
What Is a Good Engagement Rate on Instagram in 2026
Learn what is a good engagement rate on Instagram in 2026: benchmarks by follower, reach, industry and format, plus how to read them.
On a per-follower basis, about 0.5% is above the all-industry median of 0.36%, and 1% or higher is a strong result for established brand accounts, but only when the same formula is used. That qualification decides whether the answer helps you or misleads you.
The same account can look weak on one calculation and strong on another without its content changing at all. A follower-based rate judges interaction against the audience an account has built over time. A reach-based rate judges interaction among people who saw the post. Those are different questions, and they produce different percentages. If you don't know which base sits underneath a number, you can't know whether it's good.
That's why asking what is a good engagement rate without naming the denominator is like asking whether a score is high without naming the test. The useful answer comes in rows, not as one universal line.
Table of Contents
- What Counts as a Good Engagement Rate Today
- Why the Denominator Changes Everything
- How Industry Changes the Benchmark
- How Post Format Shifts the Numbers
- How to Calculate and Read Your Own Rate
- Misreadings That Make Rates Look Better or Worse
- Choose the Benchmark That Fits Your Decision
What Counts as a Good Engagement Rate Today
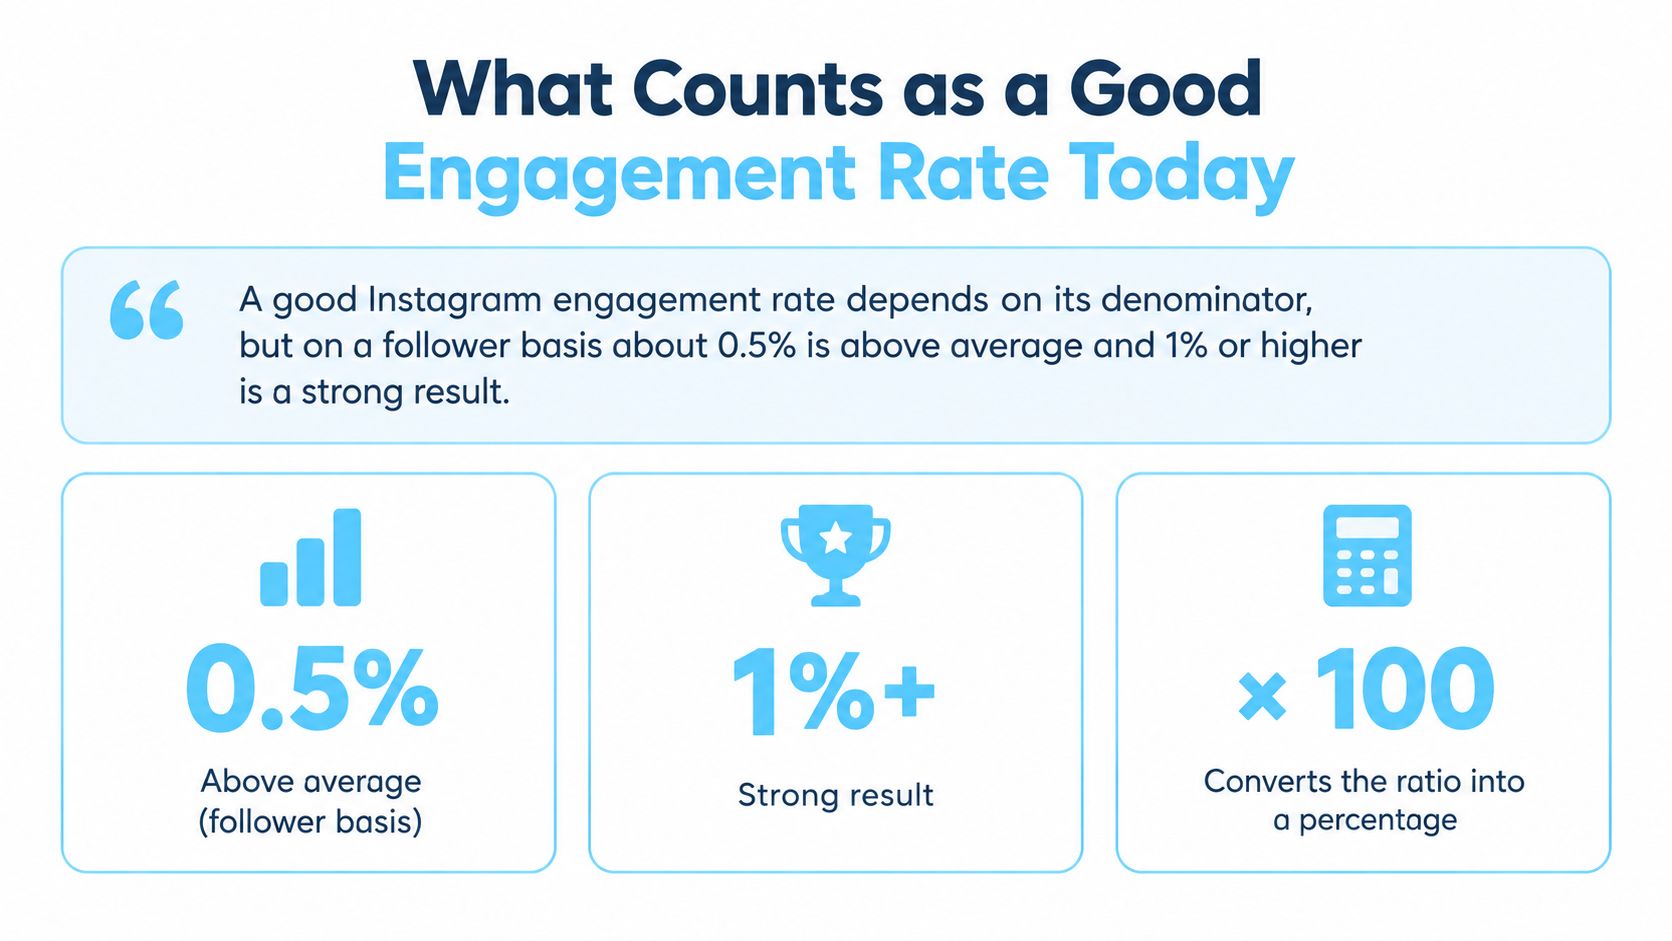
A good Instagram engagement rate depends on its denominator, but on a follower basis about 0.5% is above average and 1% or higher is a strong result for an established brand.
Treat that 0.5% line as a working threshold, not as a sourced median. The sourced anchors sit around it and give you the scale.
Instagram Engagement Rate Benchmarks by Denominator
| Denominator | Benchmark | Source | Reading |
|---|---|---|---|
| Followers | 0.36% all-industry median | 2025 Rival IQ-based dataset | Typical, not exceptional |
| Followers | 0.5% | Working threshold | Above the median, not a sourced figure |
| Followers | 1.05% or higher | Top quartile, 2025 dataset | Strong for established brands |
| Impressions | 0.45% to 0.60% | Adobe 2025 benchmark | Practical cross-platform average |
| Reach | 3.6% | 2025 benchmark of 2,967 company accounts | Not comparable with follower rates |
The follower-based figures come from Rival IQ's guide to a good Instagram engagement rate, which reports an all-industry median near 0.36% and top-quartile brands at roughly 1.05% or higher. The reach-based figure is a separate scale, reported in Dash Social's 2025 Instagram benchmark of 2,967 global company accounts at 3.6% using likes, comments, and shares divided by reach.
These rows aren't one ladder. A 3.6% reach rate doesn't beat a 0.5% follower rate, because the bases differ. Match your formula to the matching row before you judge anything.
- Near 0.4% per follower is typical: That's close to the broad median, so it isn't a failure and it isn't standout performance.
- 1% per follower is strong for a brand: It sits near top-quartile territory for established accounts in many categories.
- A reach rate needs a reach benchmark: Never place it on the same line as a follower rate and call the bigger number better.
Why the Denominator Changes Everything
Think of a classroom with 30 students enrolled, where 12 showed up on a given day and a handful passed a quiz. Divide the passes by everyone enrolled and the pass rate looks modest. Divide by only the students who were present and the same passes produce a much higher rate. Nobody learned more between the two calculations. The base changed, so the percentage changed.
Instagram works the same way. Engagement rate is total interactions divided by a base, multiplied by 100, and Adobe's 2025 guide to social media engagement rates describes the common versions of that formula. The numerator usually combines likes, comments, saves, and shares. The denominator is where reports often diverge.

The Three Bases in Plain Terms
- Followers are the enrolled class: This base measures interaction against the account's accumulated audience, including people who never saw the post.
- Reach is who showed up: This base counts the accounts that saw the content, so it speaks more directly to how the post landed.
- Impressions count every view: Repeat views are included, so one person seeing a post twice raises the base twice.
Because reach is usually smaller than the follower total, the same interactions divided by reach produce a larger percentage. That's arithmetic, not improvement. A team that switches formulas midyear can report a jump that never happened, and a team comparing two tools can rank accounts backwards without noticing.
Historical comparisons carry the same risk. If last quarter used followers and this quarter uses impressions, the trend line is fiction. Preserve one formula across the periods you compare, and if you must change it, recalculate the older period on the new basis.
A rate is comparable only when its denominator, content window, and account type match, so write the formula next to every number you publish.
How Industry Changes the Benchmark
One number can't judge every account because audiences in different categories behave differently. The industry figures below come from the benchmark summarized on Later's Instagram engagement rate calculator page, and they show how wide the spread gets.
Average Engagement Rate by Industry in the Cited Benchmark
| Industry | Average engagement rate | Reading |
|---|---|---|
| Higher education | 2.1% | Highest category listed, community-driven audiences |
| Sports teams | 1.3% | Strong, fan loyalty drives interaction |
| Nonprofits | 0.56% | Above the 0.36% all-industry median |
| Health and beauty | 0.44% | Ordinary for the category |
| Financial services | 0.26% | Low, interaction is rarely the goal |
| Retail | 0.16% | Lowest category listed, large audiences dilute the rate |
Read those rows against each other and the point sharpens. A result of 0.44% is ordinary in health and beauty, exactly where the category sits. The identical result would look weak for a higher education account, where the listed average is 2.1%. Meanwhile a retail account posting around its category level may be performing normally even though its number would alarm a sports team.
How to Use Your Category Row
Find your category's row first and judge against that, not against the all-industry median. If your niche isn't listed, pick the closest category and state that choice in your report so readers can challenge it. Tools that classify an account's category, such as the niche classification endpoint documentation, help you place an unfamiliar account before you benchmark it.
Account type matters alongside industry. A niche creator with a small, loyal audience and a large retail chain shouldn't share one benchmark line, because small communities often produce higher follower-based rates while very large audiences dilute them. The cited benchmark gives no account-size bands, so treat size qualitatively and prefer size-matched comparisons where your data allows.
One caution stays attached to the whole table. All of these figures come from one cited benchmark, and other sources may define engagement differently. Use the rows for relative placement within that source, not as universal targets.
How Post Format Shifts the Numbers
Format can move a rate further than many teams expect, and it can do so without any change in content quality. The 2024 Later benchmark reported very different averages across the three main formats.
Average Engagement Rate by Instagram Format
| Format | Average engagement rate | Note |
|---|---|---|
| Feed posts | 10.09% | Different definition from follower-based medians |
| Reels | 6.21% | Compare with other Reels, not with feed posts |
| Stories | 1.87% | Compare with other Stories over the same window |
Those percentages measure a different thing from the per-follower median discussed earlier, so don't set them beside the 0.36% benchmark. They use different definitions, samples, and bases. Placing them on one scale would make feed posts look absurdly strong and brand accounts look broken, when neither conclusion follows.
Why Your Format Mix Moves the Average
Consider an account whose output leans heavily toward Reels with a smaller share of Stories. Its blended rate sits somewhere between the two format levels. If the team shifts the mix toward Stories next quarter, the blended rate falls even if every individual Story and Reel performs exactly as before. The average moved because the recipe changed, not because the audience cooled.
The fix is to sort before you average. Benchmark each format against its own row, and compare periods only when the format mix is similar. When you pull Reels data for that split, the Reels endpoint documentation shows the per-post fields you can work with.
So a Stories result near 1.87% and a Reels result near 6.21% can both be healthy for the same account. Judged against each other they'd look like a problem. Judged against their own format rows, they're just normal.
How to Calculate and Read Your Own Rate
The arithmetic is simple, but the inputs need discipline. Most bad engagement rates aren't calculated wrong, they're assembled from sloppy inputs and then compared against the wrong row.
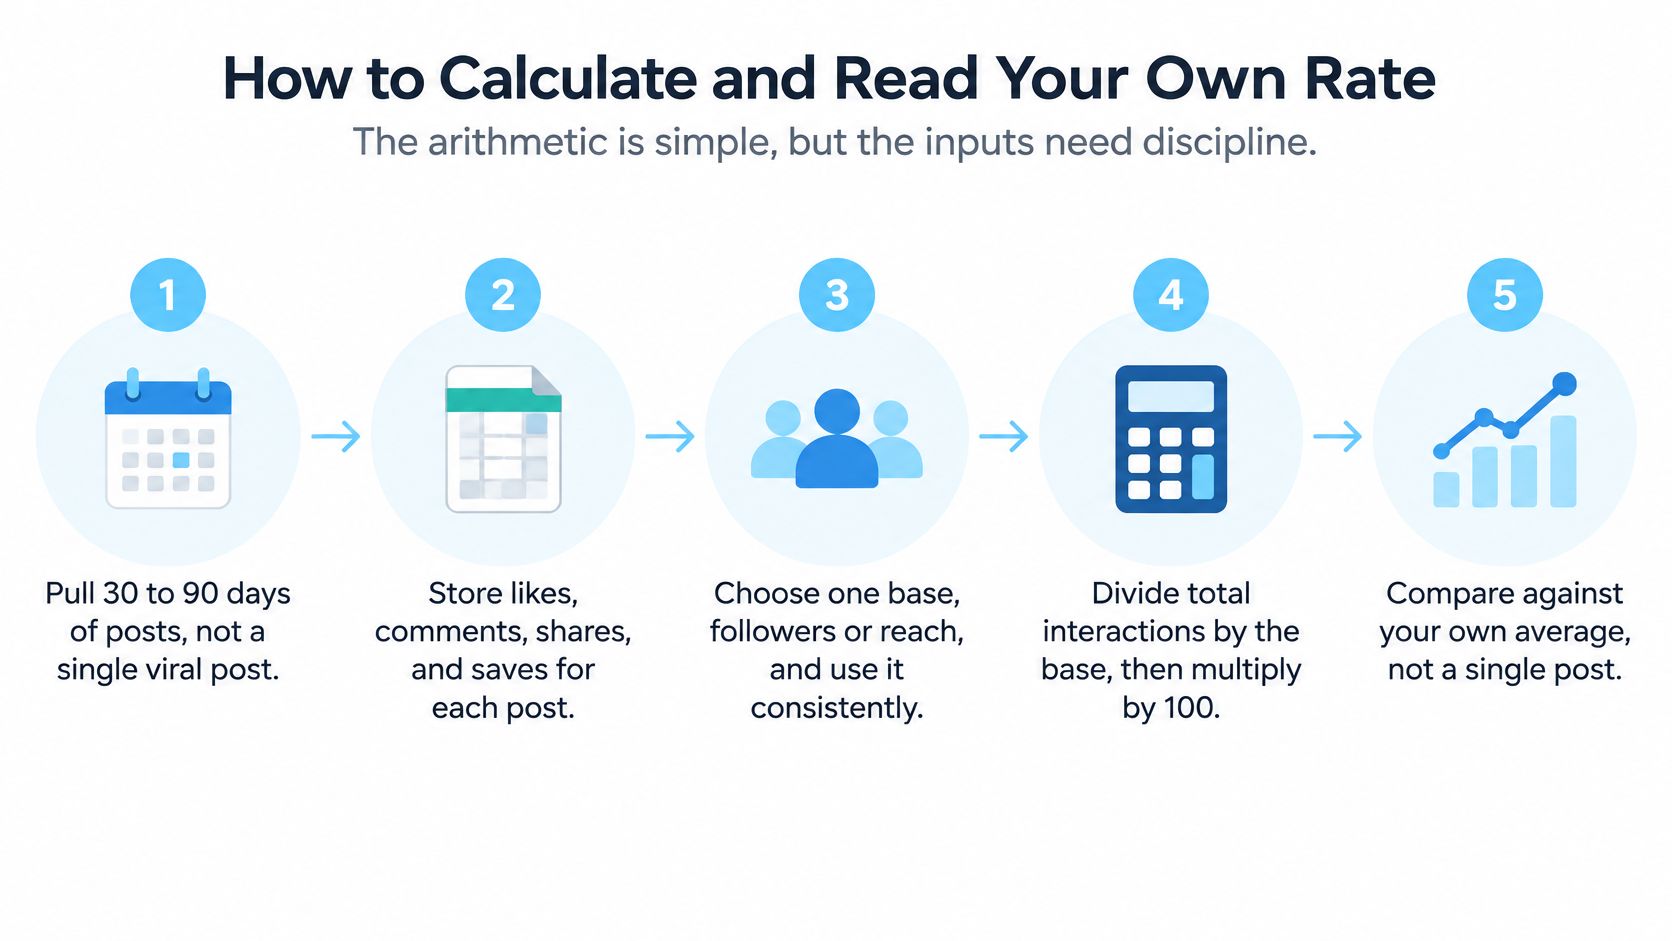
The Calculation in Seven Steps
- Pull 30 to 90 days of posts: A window that size smooths out single-post spikes, and the benchmark guidance favors a sample like this over one viral post.
- Store each interaction type separately: Keep likes, comments, saves, and shares as their own fields so you can rebuild the numerator if a definition changes.
- Snapshot the follower count: Record it on the day you calculate and keep it as the denominator, because a drifting follower count rewrites history.
- Run the division: Sum the interactions, divide by followers, and multiply by 100 to get your per-follower rate.
- Repeat with reach if you have it: Label that result engagement_rate_by_reach so nobody mistakes it for the follower-based figure.
- Report the median and percentiles: Add the 25th and 75th percentiles beside the average, since a median resists the outliers that drag a mean around.
- Compare against a matching benchmark: Only use a benchmark row built on the same formula, otherwise the comparison is decorative.
If you want account-level inputs without assembling them post by post, the profile stats endpoint documentation covers the summary fields behind this workflow. Our API also includes an Engagement rate endpoint that computes engagement rate from recent posts.
A Worked Example You Can Check
Say an account averages 14 interactions per post and has 2,000 followers. Divide 14 by 2,000 and multiply by 100, and you get 0.7%. Against the 0.36% all-industry median, that's above typical, though you'd still check the industry row and the median across posts before calling it strong.
The short walkthrough below shows the same inputs being assembled step by step.
Misreadings That Make Rates Look Better or Worse
The most common trap is the single viral post. One Reel that travels far beyond the follower base can lift a 90-day average enough to hide a weak baseline. The fix is to report the median and look at the spread across posts, so one outlier can't impersonate a trend.
Small accounts create the second trap. A few hundred loyal followers who know the creator personally will interact at a high rate, and that rate often doesn't survive growth. Treat a strong follower-based rate on a tiny account as a signal about that community, not as proof it'll hold at ten times the size.
Two More Traps Worth Naming
- Boosted posts inflate the base and the response: Paid distribution changes reach and impressions, so separate boosted posts from organic ones before you compare anything.
- Mixed bases in one table create false rankings: If one column divides by followers and another by reach, the ranking is meaningless, so label every column with its base.
The reason reach-based numbers look so flattering is spelled out in an academic analysis of Instagram engagement definitions, which defines the reach version as total interactions divided by reach or impressions, multiplied by 100, so 100 interactions from 1,000 reached users equals 10%. Since reach is usually smaller than the follower count, that version can look dramatically higher for the identical post.
Before you trust any rate, ask four questions. Which base, which window, which format mix, and which account size? If a report can't answer all four, the number isn't ready to support a decision.
Choose the Benchmark That Fits Your Decision
Start from the decision, not from the number. The same account can be the right pick for a campaign and the wrong model for creative testing, and each judgment needs its own denominator.
Which Denominator and Benchmark to Use for Each Decision
| Decision | Denominator | Benchmark to compare against |
|---|---|---|
| Comparing creators for a campaign | Followers | Industry row, then 0.5% and 1% as thresholds |
| Diagnosing one post's creative | Reach or impressions | The account's own 90-day reach baseline |
| Judging a boosted post | Reach, paid and organic split | Organic posts from the same period |
| Benchmarking a brand against its category | Followers | The matching industry row |
| Checking community quality | Followers, with comment and save ratios | The account's own trend over 90 days |
Follower-based rates suit public, account-level comparisons because follower counts are visible and the base is stable. Reach-based rates suit creative diagnosis because they ask how people responded once they saw the post, which removes distribution from the verdict. For profile lookups, our Profile endpoint /v1/profile returns username, full name, verification status, category, follower count, following count, post count, engagement rate, external URL, and profile picture URL, which gives you the denominator and the account type in one response.
Before you call any account good, confirm three things. The formula is written beside the number, the window covers 30 to 90 days, and the category row matches the account. If your decision needs a benchmark that isn't covered here, say so in the report rather than borrowing a row from another basis. An honest gap beats a confident mismatch.
If you're computing engagement rates across many accounts, Instagram API gives you an engagement rate endpoint that calculates the rate from recent posts, plus profile data with the follower counts and category you need to benchmark it properly. Pull the numbers programmatically, keep the denominator attached to every result, and compare each account against the row that fits it.
Pull Instagram data with one API call
Profiles, posts, reels, followers and more. 50 free credits, no credit card.
Get your free key