
Instagram Engagement Rate Calculator: How to Calculate It
Use an Instagram engagement rate calculator correctly: choose the right formula, work a real example, and read the result against 2026 benchmarks.
The default public formula is (likes + comments) ÷ followers × 100: for example, an account with 12,000 followers and 540 likes plus comments per post has a 4.5% engagement rate. Changing the denominator or the interactions counted changes the number.
That's why the popular advice to find your rate and compare it with a universal target doesn't work. An Instagram engagement rate calculator performs arithmetic, but you still have to choose what it measures. Before you use the result to shortlist a creator, judge a Reel, or report campaign performance, label the method clearly enough that someone else could reproduce it.
Table of Contents
- Instagram Engagement Rate Formulas and Their Inputs
- Choosing Between Followers, Reach and Impressions
- How to Calculate Engagement Rate Step by Step
- What Engagement Rate Benchmarks Actually Tell You
- Fix Mismatched Results and Track Them Monthly
Instagram Engagement Rate Formulas and Their Inputs
For a public account, start with public follower-based engagement rate. Use visible likes and comments, then divide by the follower count. If you're calculating an account average, use average interactions per post rather than adding an entire posting period's interactions and treating that total as one post.
Instagram engagement rate formulas and their inputs
| Formula | Calculation | Inputs you need | Best for |
|---|---|---|---|
| Public follower-based | (likes + comments) ÷ followers × 100 | Visible likes, comments, follower count; public data | Comparing public accounts |
| Owner follower-based | (likes + comments + saves + shares) ÷ followers × 100 | All four interactions and follower count; account-management access | Tracking your own account over time |
| Reach-based | Interactions ÷ reach × 100 | Interactions and reach for the same posts; owner insights | Judging whether content worked |
| Impressions-based | Interactions ÷ impressions × 100 | Interactions and impressions; owner or campaign reporting access | Checking delivery efficiency on boosted posts |
| Per-post average | Average of each post's rate across the last N posts | Per-post rates and post count; access appropriate to the underlying formula | An account-level snapshot |
The per-post average is an aggregation method, not another denominator. You must still specify whether each underlying rate uses followers, reach, or impressions.
Define interactions before calculating
Meta's Instagram Insights documentation describes interactions including likes, saves, comments, shares, and replies across supported content types, and its professional-account API access explains why owner analytics can contain fields unavailable in public-profile calculations. Don't assume every content format exposes an identical set of metrics.
For broader context on choosing meaningful actions, PostSyncer's guide to engagement metrics beyond follower counts is a useful companion to the arithmetic.
Store the component fields, content type, measurement period, and access level, not just the percentage. That gives you a way to distinguish a content-level result from an account average without reconstructing the calculation later.
Working rule: Write the formula name beside every result. An unlabeled engagement rate isn't ready for comparison.
Choosing Between Followers, Reach and Impressions
Choose the denominator based on the decision you're making, not whichever option produces the most flattering percentage. These measures answer different operational questions.
The visual below captures that choice before you open a calculator.

Match the denominator to the decision
You're comparing creators for a sponsorship. Use follower-based rates when you only have public information. Keep creators within a comparable follower tier, and apply the same post-selection rules to both, including whether sponsored posts belong in the sample.
You're evaluating a Reel series you manage. Use reach-based engagement to examine interactions relative to the people who received the content. Later's engagement-rate guide distinguishes follower-based comparisons from reach-based evaluation and explains why reach can include non-followers reached through discovery.
A high follower-based result can reflect a small, active audience. But recommendation-driven distribution requires a separate check: inspect non-follower reach rather than assuming a high reach-based rate proves the recommendation system distributed the post widely.
You're reviewing a boosted post. Use impressions-based engagement to assess interactions relative to delivery. Keep the paid and organic scope aligned: dividing combined interactions by paid-only impressions produces a result you can't interpret cleanly.
Keep data coverage visible
Public calculators can't generally retrieve another account's private saves and shares. A public score and an owner-dashboard score therefore shouldn't sit side by side under an identical engagement-rate label.
Build a data-coverage field into your worksheet or reporting interface. Use descriptions such as visible likes and comments, owner interactions including saves and shares, or incomplete interaction coverage. Missing isn't the same as zero.
For teams tracking audience response across client accounts, SleekPost's guide offers useful context for interpreting audience actions rather than treating every interaction as interchangeable. When structuring an automated comparison, use the account statistics documentation to plan the account context you'll keep alongside each calculation.
- Preserve the interaction mix. Record likes, comments, saves, and shares separately where available.
- Inspect the dominant action. A comment-heavy result deserves different interpretation from one driven by saves.
- Avoid audience claims from action counts. Interactions aren't necessarily unique people, so the rate isn't automatically the percentage of viewers who engaged.
How to Calculate Engagement Rate Step by Step
Start in Google Sheets or Excel with a row for each post. Keep the raw counts in separate columns so you can change the formula without collecting everything again.
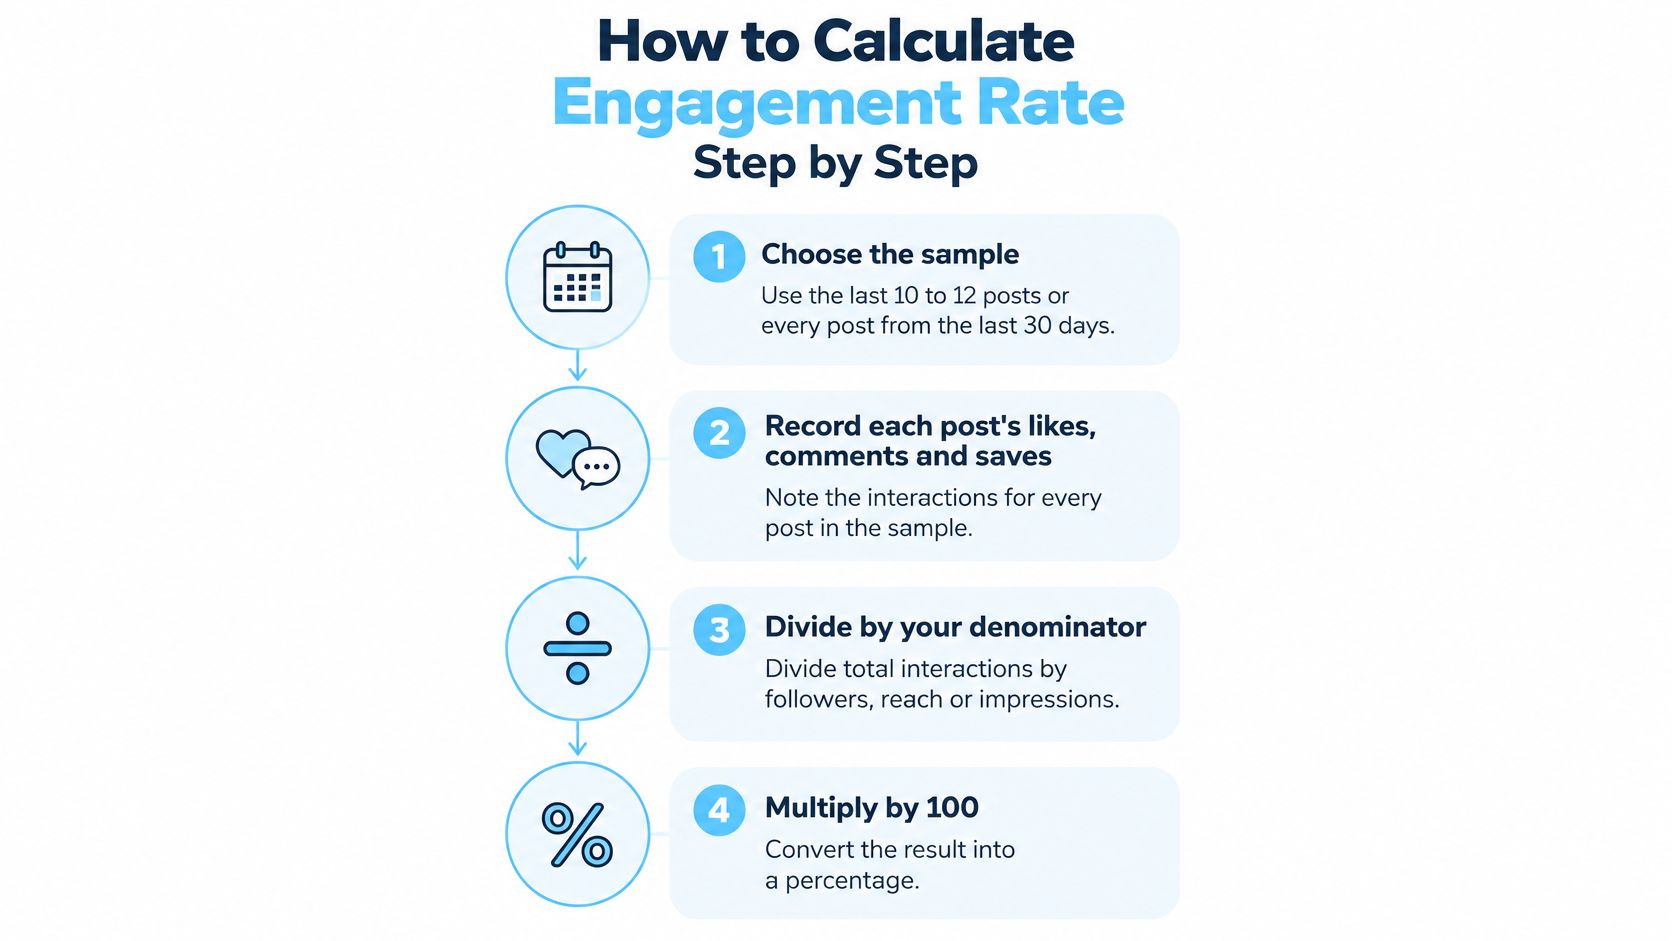
Use this process graphic as a checklist, while retaining the detailed inputs in your worksheet.
Build a reproducible calculation
Choose the sample. Select a recent-post window or a complete calendar period before inspecting performance. If you want a format-level answer, include only that format and record any exclusions.
Record the available actions. Enter each post's likes and comments, adding saves and shares only when you have access. Leave unavailable fields blank and mark their coverage rather than entering invented zeros.
Select the denominator. For historical follower-based analysis, use the follower count recorded on each posting date when available. If you only have today's count, identify that substitution so readers understand the approximation.
Calculate each post's rate. Add the selected interactions, divide by the appropriate denominator, and convert the result to a percentage. In a spreadsheet, either multiply by 100 and retain a numeric cell or use percentage formatting on the fraction, not both.
Choose the summary method. Average the individual post rates for a mean per-post result. Dividing total interactions by post count times follower count gives the same answer only when that follower denominator stays constant.
Label the output. Add the date range, sample size, content format, interaction components, denominator, and collection date. Record paid status too if you're evaluating campaign content.
Keep full precision in your worksheet. Round the displayed result only after the calculation, so intermediate rounding doesn't alter the account summary.
Work through the arithmetic
Hypothetical account average. Say an account has a constant 12,000 followers, and its 10 sampled posts receive 5,400 visible likes and comments in total. Average interactions are 5,400 ÷ 10 = 540, so the public follower-based rate is 540 ÷ 12,000 × 100 = 4.5%.
Label that result as a mean per-post rate for the selected sample. Don't describe it as a period-wide unique-audience engagement rate.
Hypothetical owner-only Reel result. Say one Reel receives 1,180 likes, 74 comments, 96 shares, and 210 saves. That gives 1,560 interactions, and with 12,000 followers, the owner follower-based calculation is 1,560 ÷ 12,000 × 100 = 13.0%.
That Reel's result isn't a replacement for the account average. It represents a different sample and includes additional interaction types, so its label must preserve both differences.
If you prefer a video walkthrough, use it alongside the worksheet rather than copying a displayed percentage without its inputs.
What Engagement Rate Benchmarks Actually Tell You
| Source | Year | Measure | Reported value |
|---|---|---|---|
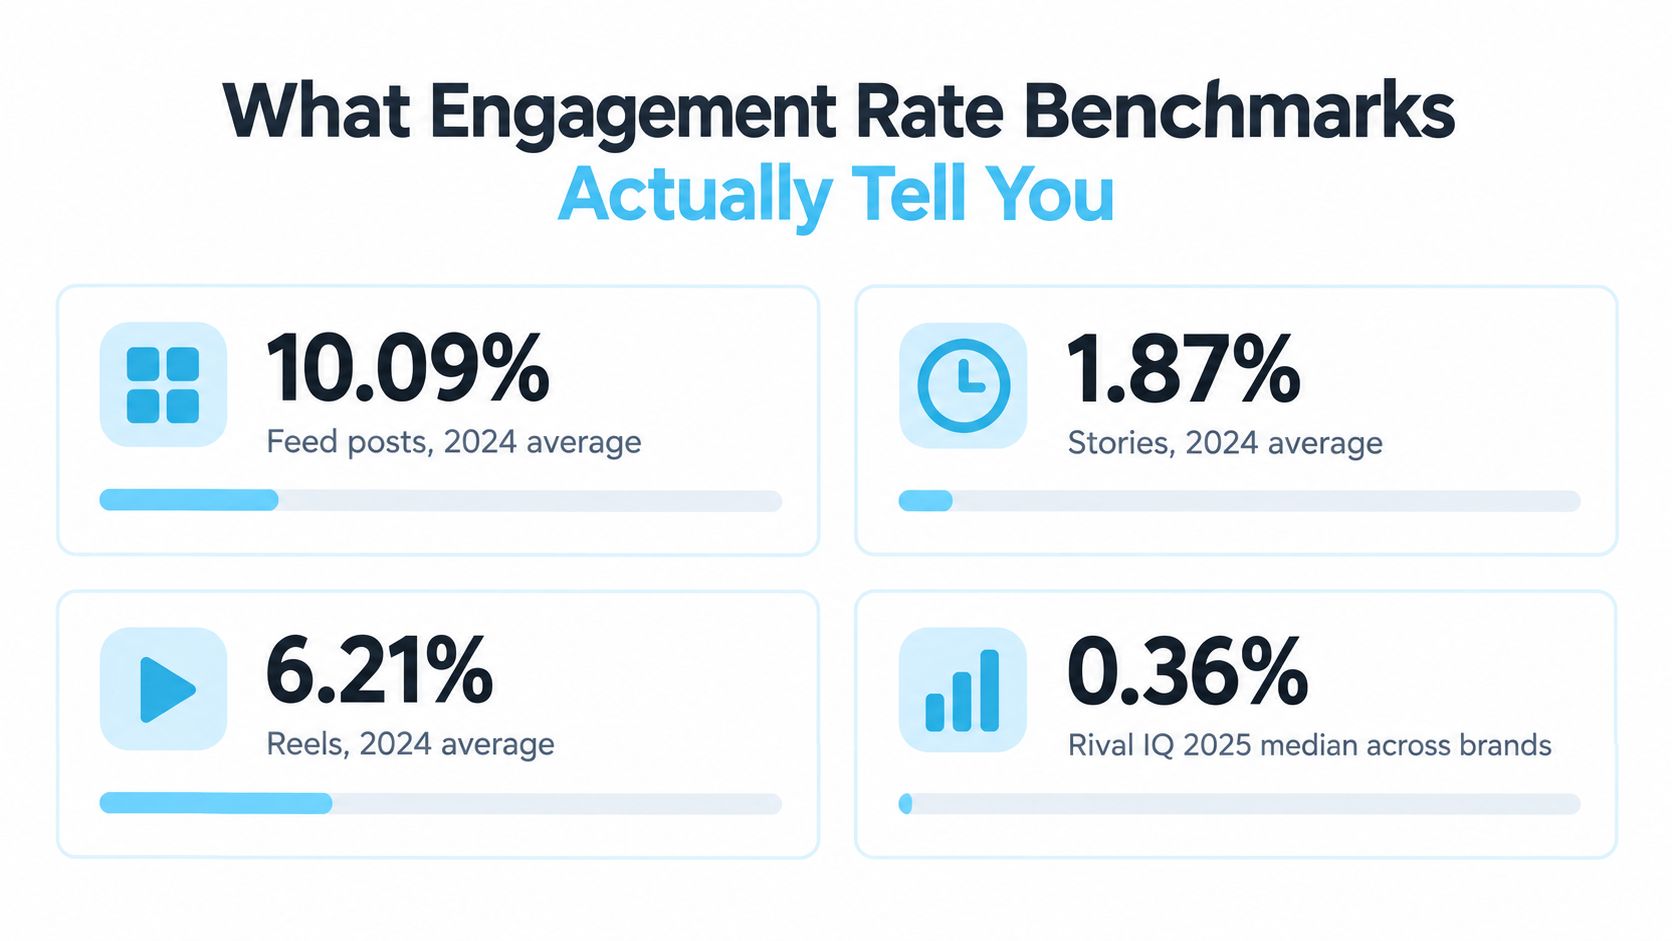
| Later | 2024 | Average, feed posts | 10.09% |
| Later | 2024 | Average, Stories | 1.87% |
| Later | 2024 | Average, Reels | 6.21% |
| Rival IQ | 2025 | Median across brands in all industries | 0.36% |
| Rival IQ | 2025 | Top quartile across brands in all industries | 1.05% |
| Buffer | January 2024 versus January 2025 | Instagram median | 2.94% versus 0.61% |
| Statista | 2024 | Brand content, carousel posts | Highest of formats compared |
These published benchmarks describe different groups, formats, and summary measures, not interchangeable targets for your account. Their spread is a reason to inspect methodology before rating your performance.
The graphic highlights the published format averages and brand median, but it shouldn't be read as a like-for-like ranking.
Compare matching measures, not attractive numbers
An average and a median don't describe the same thing. A mean incorporates the size of unusually strong results; a median describes the middle observation. Neither becomes the right target just because it appears on a calculator page.
Likewise, the change between Buffer's reporting periods doesn't establish that every account experienced the same decline. A platform-level comparison can't explain an individual account's performance without checking that account's content and measurement conditions.
Statista's carousel finding also has a specific scope: brand content among the formats it compared. It doesn't establish that every creator should replace Reels with carousels, or that carousels will deliver the strongest business outcome.
Place your result in a suitable comparison group
Use this sequence before calling a result strong or weak:
- Match the population. Separate brands from creators, then look for a comparable follower tier, industry, and market.
- Match the content. Compare a Reel result with a Reel benchmark, not a combined feed-and-Stories measure.
- Match the calculation. Confirm the numerator, denominator, and averaging method before assigning a performance label.
- Match the period. Prefer a relevant reporting window instead of treating an old threshold as permanent.
Once those conditions align, describe the result as below the matching median, near it, or within the published top quartile where that boundary is available. Don't manufacture a percentile from a benchmark that supplies only an average.
Use the profile audit documentation when adding account-quality checks to a creator review. Keep those checks separate from benchmark placement: audience credibility and interaction performance are related evaluation tasks, but they aren't the same score.
A benchmark is useful only when you can explain who was measured and how. Otherwise, track your own matched historical results instead.
Fix Mismatched Results and Track Them Monthly
When calculators disagree, don't average their outputs or assume the higher number is more accurate. Reconstruct their inputs and reconcile the method before making a decision.
Also reject the idea that one percentage threshold can settle account quality. SocialBee's Instagram engagement-rate calculator guidance illustrates why benchmark interpretation needs account-size and measurement context rather than a universal good-rate label.
Engagement rate symptoms, likely causes and fixes
| Symptom | Likely cause | Fix |
|---|---|---|
| Two tools show different rates for the same post | Different denominator, or saves and shares counted in one only | Recalculate both with the same formula and inputs |
| High rate but low reach | Small follower base or one comment-heavy post | Check the reach-based rate and the comment share |
| Sudden drop in rate | Format mix changed or a possible platform-wide decline | Compare the same format over the same months |
| Rate looks inflated or otherwise implausible | Manipulated interactions, incomplete counts, or follower-quality problems | Audit interaction and follower quality before trusting the figure |
| One post dominates the average | A single viral post | Use the median post rate for typical performance, retaining the mean separately |
| Reels and carousels averaged together | Format effects hidden in one number | Split the calculation by content format |
| Public score lower than owner dashboard | Saves and shares invisible to public data | Label the result as public-data only |
Diagnose the direction of the problem
Inactive or purchased followers enlarge the denominator, which generally depresses a follower-based rate rather than inflating it. Purchased interactions can inflate the numerator, so review both sides of the calculation instead of treating every suspicious result as a fake-follower problem.
For a comment-heavy post, read the comments and inspect who contributed them. For an outlier-driven account average, preserve the viral post in the record but use the median to describe typical post performance.
A sudden decline needs a controlled comparison before an explanation. Check comparable formats and collection ages, and separate boosted content from organic posts before attributing the change to the platform.
Set up a monthly tracker
A spreadsheet is enough for an individual account if you maintain a consistent protocol.
- Name the question and formula. Put the decision you're supporting beside the calculation method.
- Record the scope. Include date range, post count, denominator, format mix, and interaction coverage.
- Preserve historical inputs. Capture follower counts on posting dates and use a consistent post-age collection rule.
- Choose a sampling policy. Keep either a fixed recent-post count or a complete monthly window. With calendar windows, disclose changing post counts.
- Flag weak samples. Mark very small samples as low confidence under an explicit internal policy, not as a statistically validated cutoff.
For repeatable workflows, our Engagement rate endpoint computes engagement rate from recent posts. The analytics integration documentation can support implementation planning, but keep your method labels and raw observations alongside any calculated output.
Instagram API offers public Instagram data and insight endpoints for workflows including influencer analytics, brand monitoring, lead generation, and AI agents. Visit Instagram API to build a repeatable engagement-rate workflow, then store each result with its formula, sample, and data-coverage label so your team compares matching measures.
Pull Instagram data with one API call
Profiles, posts, reels, followers and more. 50 free credits, no credit card.
Get your free key